Disclaimer: This Blog, its owner, creator & contributor is neither a research analyst nor an Investment Advisor and expressing opinion only as an Investor in Indian equities.He/She is not responsible for any loss arising out of any information,post or opinion appearing on this blog.Investors are advised to do own due diligence and/or consult financial consultant before acting on any such information
Showing posts with label NEWS. Show all posts

Sunday, 13 January 2019

Apollotyre - A view

APOLLOTYRE 

Apollotyre is one of the best of India's Tyre company... Started in the year 1972, running successfully Market capital is 12,937 cr.. 

This stock is forming an inside candle in daily time frame on 11/1/2019 


Apollotyre will be seeing buying abv 235 only 
when it breaks 222 in coming days u can see a sell off in this counter 

This is only for educational purpose watch and trade at your own risk 

Thursday, 3 January 2019

BAJAJ-AUTO - a view


BAJAJ - AUTO 

Leading Auto sector stock is getting ready to move up int he coming days after a fall from top.. In the coming days u can buy 2747 in cash.. 
If this stock comes below 2677 in cash u can see some sell off...so keep an eye on this stock during january 2019 

Sunday, 30 December 2018

BANKNIFTY - BEFORE 06/01/2019

BANKNIFTY FUT
These are some of the important numbers of banknifty for the coming week before next weekly expire on 03/01/2019/
Market will be reacting only on this magic numbers so be carefull 
Buy options on the basis of these numbers will yield good results
Keep an eye on this numbers 

RELIANCE - VIEW

RELIANCE INDUSTRIES
 Reliance india's super company.. Started in the year of 1973 dealing in oil refinery, petrochemicals and textile .. 

Now its trading in the range of 1126. On 28th December 2018 this stock closed in the value of 1126 which was also the opening price. it means it closed in the formation of DOJI 

Now watch for the 1135 levels to buy in the coming days... 

1100 rs is the nearest low in last week.. so this point reacts as a good support for this stock.. If it breaks and closes below 1100 levels more down side is expected

Keep on eye on these levels

AXISBANK

AXISBANK 

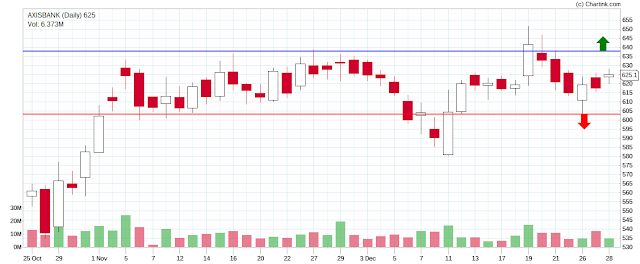
Axisbank - one of the india's best private bank.. Started in the year 1993 now trading in the range of 625... 

This stock is mostly in the consolidation line from nov 2018 this line break may happen in coming days based on the rbi policy

So keep an eye on 638 to buy or 603 to sell.. But this stock is in good for buying only till it closes above 620 

So 620 is the LAKSHMAN REKA Keep en eye 

Saturday, 29 December 2018

HINDZINC - JUST A VIEW


Hindzinc is the only integrated producer of zinc and lead.This company produces three type of zinc used in various construction, household appliances, and also inftrasture.. Lead produced  by this company is also having a very wide market in india and abroad.

This company came into existence in the year 1966.. Now running a very good business

In the current scenario 267.20 seems to be a very good support for this stock in the coming days this number should not be broken, if it happens we can see some new low in the next following days..

So keep an eye on this number on closing basis 

Wednesday, 26 December 2018

AUROPHARMA

Auropharma one of the leading pharma stock is expected to bounce from todays high if breaks..
Wait and watch for that level break in january 2019

If it breaks and closes next target for this stocks will be 760
Its purely for educational purpose so watch and trade on ur own ideas

Tuesday, 25 December 2018

SUNTV - BREAKOUT

SUNTV.

Suntv famous channel in south india after moving down from its 52 w high to a low below 50 % now forming a positive pattern..

In the monh of Jan2019 if it breaks the high of 607... we can see good breakout
Lets wait for the high to break 

M&M - STOCK A VIEW


M&M (Mahindra and Mahindra) Automobile industry.. This company come into existence before independence of india.. In 9 segments this company is performing well..

Now waiting for a breakout in the month of JANUARY 2019.. Watch this stock to break its latest high of thursday in cash 814 is the important level for this stock

Lets check out this stock in january 2019... No worries if it breaks low also when it breaks 814 we can take long.. till then lets wait and watch


QUOTES ABT SHARE MARKET

QUOTES TO REMEMBER


“If you aren’t thinking about owning a stock for ten years, don’t even think about owning it for ten minutes.”
Warren Buffett


“The stock market is filled with individuals who know the price of everything, but the value of nothing.”
Phillip Fisher

 “An investment in knowledge pays the best interest.”


“If investing is entertaining, if you’re having fun, you’re probably not making any money. Good investing is boring.”
George Soros

“Derivatives are financial weapons of mass destruction.”
Warren Buffett


Option Greeks - (Delta ) Tamil

Thursday, 22 September 2016

INSIDE CANDLE / HARAMI FORMATION

Harami

The Harami (meaning "pregnant" in Japanese) Candlestick Pattern is considered a reversal pattern. The pattern consists of two Candlesticks:


harami candlestick chart pattern


  • Larger Bullish or Bearish Candle (Day 1) 
  • Smaller Bullish or Bearish Candle (Day 2) 
The Harami Pattern is considered either bullish or bearish based on the criteria below:

Bearish Harami: A bearish Harami occurs when there is a large bullish green candle on Day 1 followed by a smaller bearish or bullish candle on Day 2. The most important aspect of the bearish Harami is that prices gapped down on Day 2 and were unable to move higher back to the close of Day 1. This is a sign that uncertainty could be entering the market.

Bullish Harami: A bullish Harami occurs when there is a large bearish red candle on Day 1 followed by a smaller bearish or bullish candle on Day 2. Again, the most important aspect of the bullish Harami is that prices gapped up on Day 2 and price was held up and unable to move lower back to the bearish close of Day 1.

Inside day / Harami formation in daily time frame gives a very good opportunity to trade in the next day opening, Every day try to find out which scrips had formed this HARAMI formation and try to keep an eye on them and trade


Saturday, 26 March 2016

MONTHLY INSIDE STOCKS

Some  stocks trading in the price range which is not higher than the february month high price and lower than the February month low price.
Both buyers and sellers are trying their best to hold their stand. If it breaks in any one direction you can see a movement of not less than 5 % in a short term
Keep this stocks in our terminal and watch

Saturday, 30 January 2016

LICHSGFIN - INSIDE FORMATION ON MONTHLY BASIS


LICHSGFIN Eq 

Monthly chart of Lichsgfin.....

In the month of december it went up to a high of 514.6 and to a low of 448.55 and in the month of january it went up to a high of 513.8 and to a low of 450.1.. This is an Inside day formation on the higher side of the stock..

Watch out the high of 514.6 and low of 448.55 for a very big movement in the near future...

This stock closed at 475.90

Breakout of these levels will get u good returns.......

Keep this scrip in radar

Sunday, 13 December 2015

Week ended 11.12.2015 formations

FORMATIONS 
 Watch these scrips for a breakout in the coming week 
Trade with strict sl
 

Monday, 30 November 2015

NOVEMBER MONTH OUTSIDE DAY formation

November Month Outside day formation in the scrips
This stocks seems to be powerful above or below the BREAKOUT
Trade abv it....

NOVEMBER MONTH INSIDE DAY FORMATION

Monthly INSIDE DAY formation happened in these scrips
Wait for a BREAKOUT and trade

Saturday, 14 November 2015

WEEKLY FORMATIONS AS ON 13.11.2015

Weekly time frame inside and outside formation in some scrips....
Watch this INSIDE FORMATION scrips there seems to be some thing which did not allow to move high or move low. Both the buyers and sellers are strong in them as soon as it breaks we can see very good rally...
Watch and trade with sl....

Tuesday, 10 November 2015

BANKNIFTY FORMATION ON 10.11.2015

BANKNIFTY AS ON 10.11.2015

Bank nifty formed an inside formation on 10.11.2015. 

When the high of 09.11.2015 that is 17069 is breakout u can see an upside of another 500 points
When the low of 09.11.2015 that is 16587 is downside breakout u can see an downside of another 700 points
So keep cool till this cross over and trade with safety.....

NIFTY AS ON 10.11.2015


NIFTY EOD CHART AS ON 10.11.2015

 Nifty spot formed an inside day on 10.11.2015 

Very good formation TREND DECIDER on DIWALI day... 

BUY BUY BUY ONLY ABOVE - 7938 

SELL SELL SELL ONLY BELOW - 7772 

On 10.11.2015 Nifty spot close at 7783. Today you can watch and trade on this only above breakout not before that...

Very good opportunity dont miss friends......